
Transform your network monitoring capabilities with the powerful combination of Arista Networks' advanced telemetry and Splunk's powerful analytics platform. This comprehensive guide will walk you through establishing a robust integration between these industry-leading solutions, enabling sophisticated network visibility and analytics.
Prerequisites
Ensure you have the following components ready:
Arista switch administrative credentials
CLI access to the Arista switch
Latest stable release of Splunk Universal Forwarder RPM package
AristaAppForSplunk SWIX file compatible with your EOS version
Splunk Cloud credentials (if using cloud deployment)
Initial Arista Switch Configuration
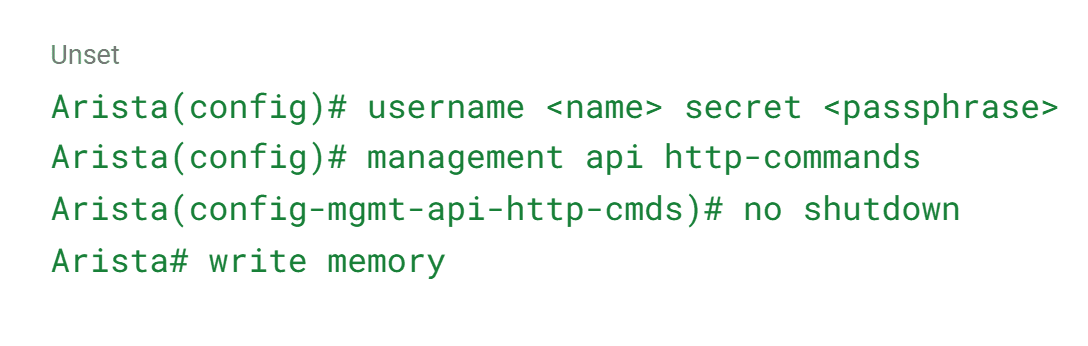
Enable eAPI Access
Begin by configuring the essential eAPI access on your Arista switch:
Configure Advanced Monitoring Features
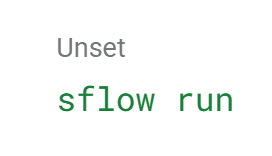
Enable comprehensive network metrics collection through sFlow:
Optimize configuration visibility by disabling running-config cache:

Core Component Installation
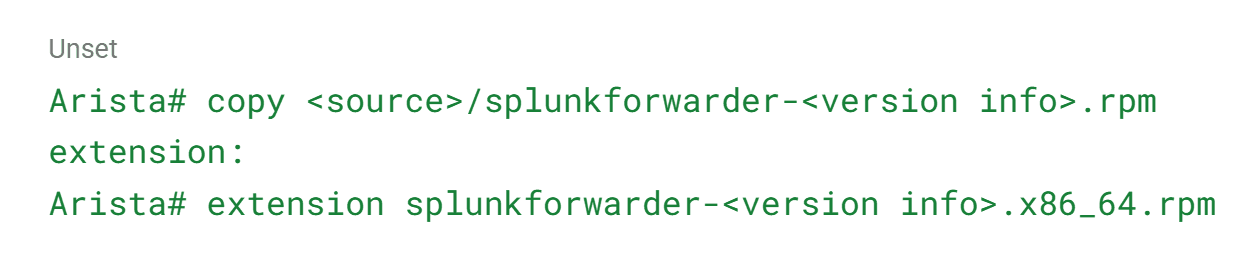
Universal Forwarder Deployment
Install Splunk's Universal Forwarder component:
AristaAppForSplunk Implementation
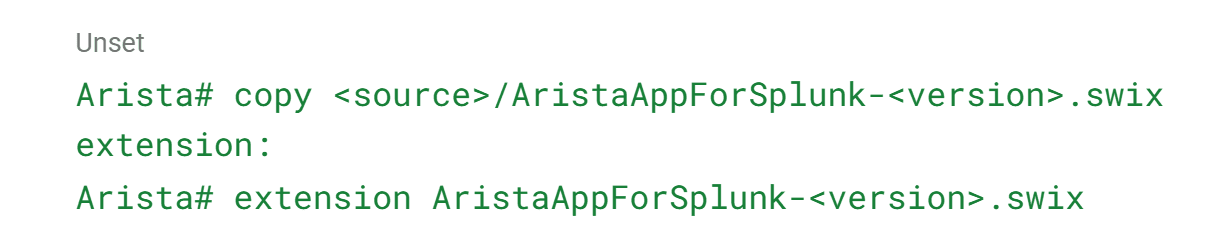
Deploy and configure the Arista-specific integration components:
Restart essential services for proper initialization:
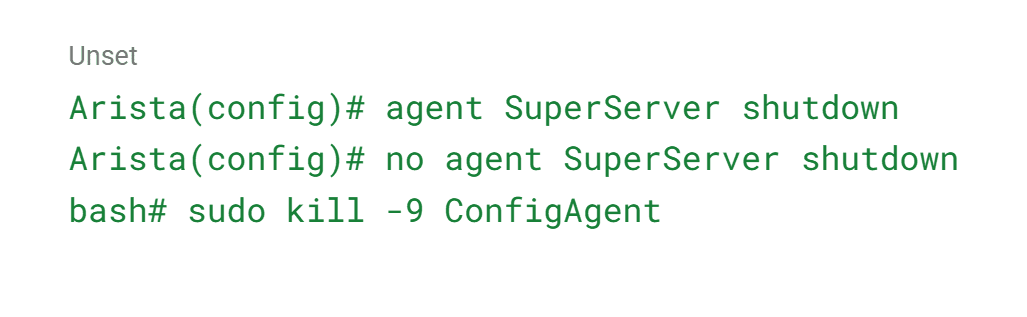
Integration Configuration
Splunk Forwarder Setup
Access and configure the forwarder settings:
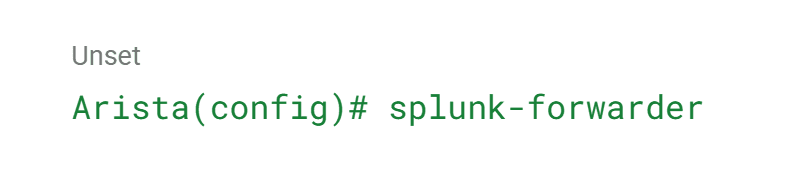
Implement secure authentication:

Note: Use <0> for development environments and <7> for production deployments.The use of <0> is recommended for development environments as the secret will be displayed in clear plain text, while the use of <7> will ensure an that the secret is encrypted and will not be displayed in that plain text.
Data Collection Configuration
Define your data collection parameters:
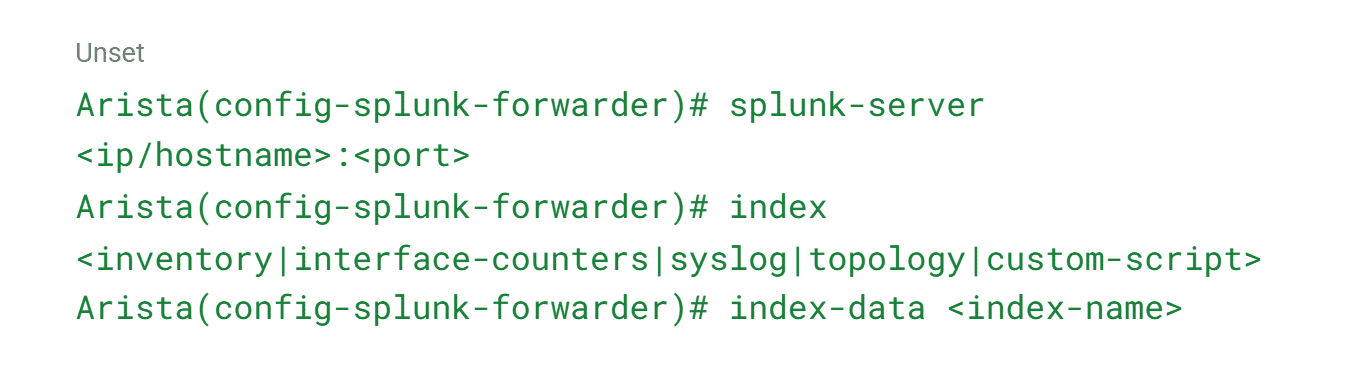
Activate your configuration:

Splunk Cloud Integration
For Splunk Cloud deployments, follow these configuration steps:
Access the bash console on the Arista switch using the EOS Command Line Interface. a. This will prompt you for your username and password.
Navigate to /opt/splunkforwarder/etc/apps
Deploy your cloud package:
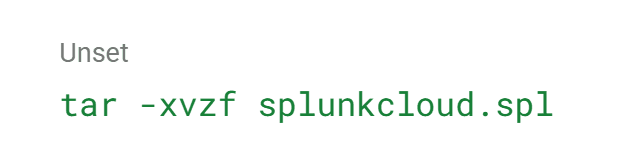
Verify file permissions
Execute Splunk restart from Arista Shell
Validate deployment status:

Validation and Monitoring Integration Health Verification
Ensure successful deployment through these key verification steps:
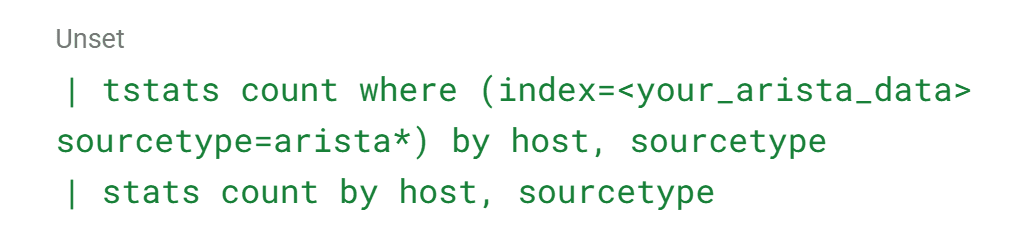
Confirm data flow in Splunk interface
The following search is a quick way to verify if the data is flowing. It allows you to view which host have successfully sent data and the type of data they have sent
Verify component network connectivity
Monitor forwarder status using show splunk-forwarder
Review system logs for potential issues
Advanced Troubleshooting
Address potential integration challenges by verifying:
Network connectivity and routing
Authentication credentials
Port configurations and firewall rules
System and application logs
Future Optimization
Your Arista Networks and Splunk integration is now ready to deliver advanced network analytics and monitoring capabilities. This foundation enables:
Real-time network visibility
Proactive performance monitoring
Advanced analytics and reporting
Automated incident response
For advanced configurations and optimization strategies, consult the official Arista Networks documentation. Enterprise support is available through both Arista and Splunk to ensure optimal deployment performance.
Welcome to enhanced network monitoring!

